Gl_cSim How-To Guide
Gl_cSim is a trace driven uni-processor cache simulator modified from DineroIV originally developed by Jan Edler and Mark D. Hill.
The simulator remains open source and free for redistribution for academic purposes. Please contact the authors regarding commercial use. Our modifications extend the original trace format with additional trace attributes provided by Gleipnir. It also uses an extensive tracking mechanisms that tracks cache performance metrics of all variables in the trace. Additional information includes a Cost-Matrix . The cost matrix is produced as a result of identifying all variable or structure conflicts in the cache.
contact: tjanjusic [at] unt [dot] edu
Installing DineroIV
Get the latest version using subversion
username: guest, password: Password2013
 $ svn co http://csrl.unt.edu/svn/tools/GL_cSIM \
--username=guest
cd into the directory and build it...
$ cd dineroIV; make;
Run it
pretty simple :)
Running DineroIV
Running dinero is straightforward; however, take a minute to look at the -help output.
It gives an idea of dineroIV's options.
Most of the cache options are highly customizable. The more common options are cache
size, line size and associativity.
#!/bin/sh

#Script to run valgrind - perl_script - dinero

benchmark='/home/janjust/valgrind_test/tests/mibench'

dinero_param1='-l1-dsize 32768 -l1-dbsize 32 -l1-dassoc 4 -l1-drepl r -informat d'
dinero_param2='-l1-dsize 32768 -l1-dbsize 32 -l1-dassoc 1 -l1-drepl r -informat d'

p_dinero='/home/janjust/janjust_svn/DineroIV_modified'
script_path='/home/janjust/research/svn_janjust'

echo Start of Script

$p_dinero/dineroIV $dinero_param2 < ~/research/test_traces/testapp.valgrind.out \
                                                             > testapp.dinero.out

echo End of Script
Dinero will produce an output file that contains access statistics for each function and each variable within that function. These statistics are used for visualizing the access behavior. The top portion of the statistics are overall statistics, followed by each identified function sorted by the total misses.
---Simulation begins.
---Simulation complete.
l1-dcache
Metrics		        Total	        Data	    Read          Write
------------	    ------	      ------      ------	     ------
Demand Fetches		 492286969 492286969   311730990	  180555979
Fraction of total	    1.0000    1.0000      0.6332	     0.3668

Demand Misses		    408289    408289      335856	      72433
Demand miss rate	    0.0008    0.0008      0.0011	     0.0004

[382007] 	 -> susan_smoothing (with 30 elements)
[8945] 	 	 -> enlarge (with 10 elements)
[6919] 	 	 -> memcpy (with 3 encluding eps pilements)
[6917] 	 	 -> mempcpy (with 2 elements)
[2454] 	 	 -> unided (with 1 elements)
[381] 	 	 -> __ieee754_exp (with 1 elements)
[166] 	 	 -> do_lookup_x (with 1 elements)
[89] 	 	 -> _dl_fixup (with 1 elements)
[58] 	 	 -> _dl_lookup_symbol_x (with 1 elements)
[37] 	 	 -> strcmp (with 1 elements)
[36] 	 	 -> check_match.8514 (with 1 elements)
[28] 	 	 -> _dl_name_match_p (with 1 elements)
[26] 	 	 -> getc (with 2 elements)
[26] 	 	 -> setup_brightness_lut (with 7 elements)
[20] 	 	 -> main (with 21 elements)
[19] 	 	 -> malloc (with 5 elements)
variable: HB 6 [98]
141 106 105 1
142 196 99 97
variable: HB 7 [98]
143 202 105 97
144 97 96 1
variable: HB 26 [76]
181 81 80 1
182 152 77 75
variable: HB 37 [61]
203 75 74 1
204 122 62 60
variable: HB 0 [4]
Visualizing the Behavior
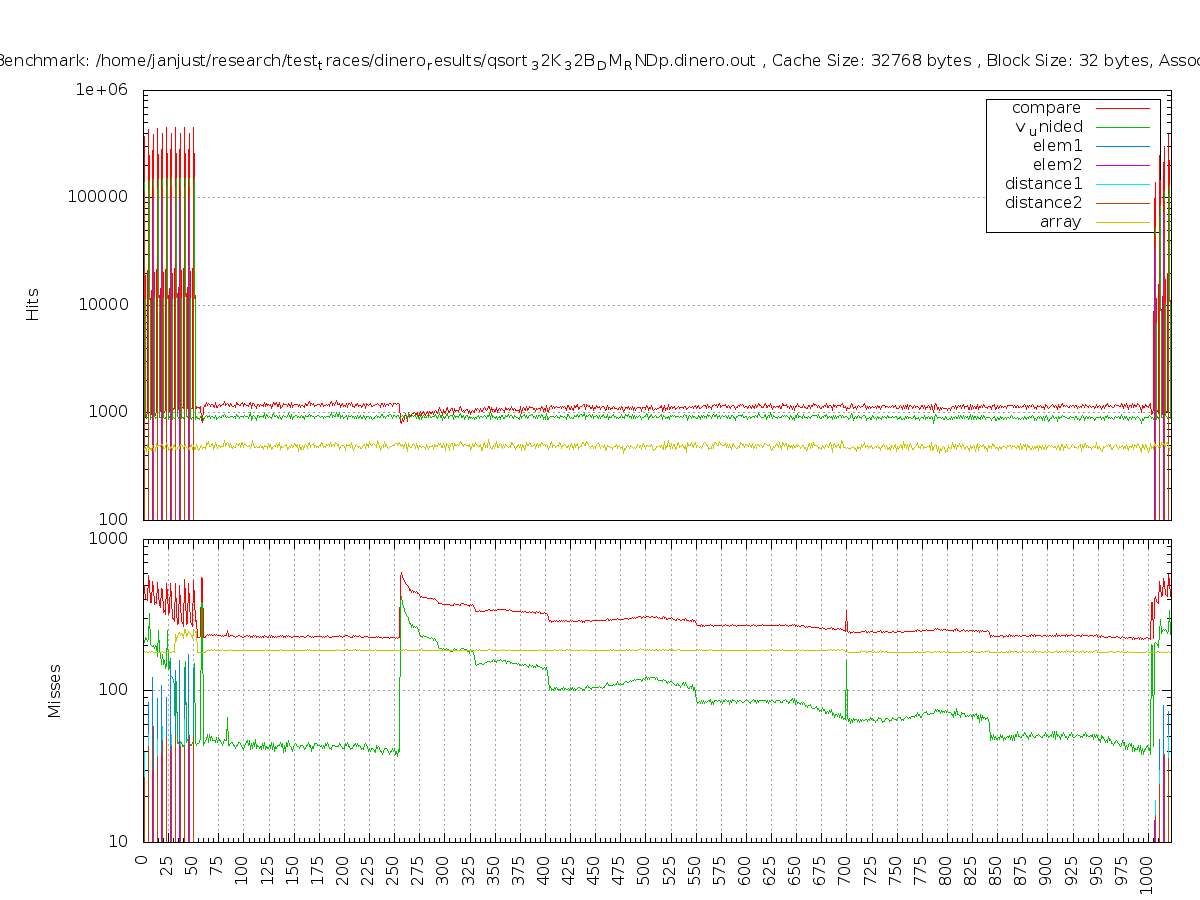
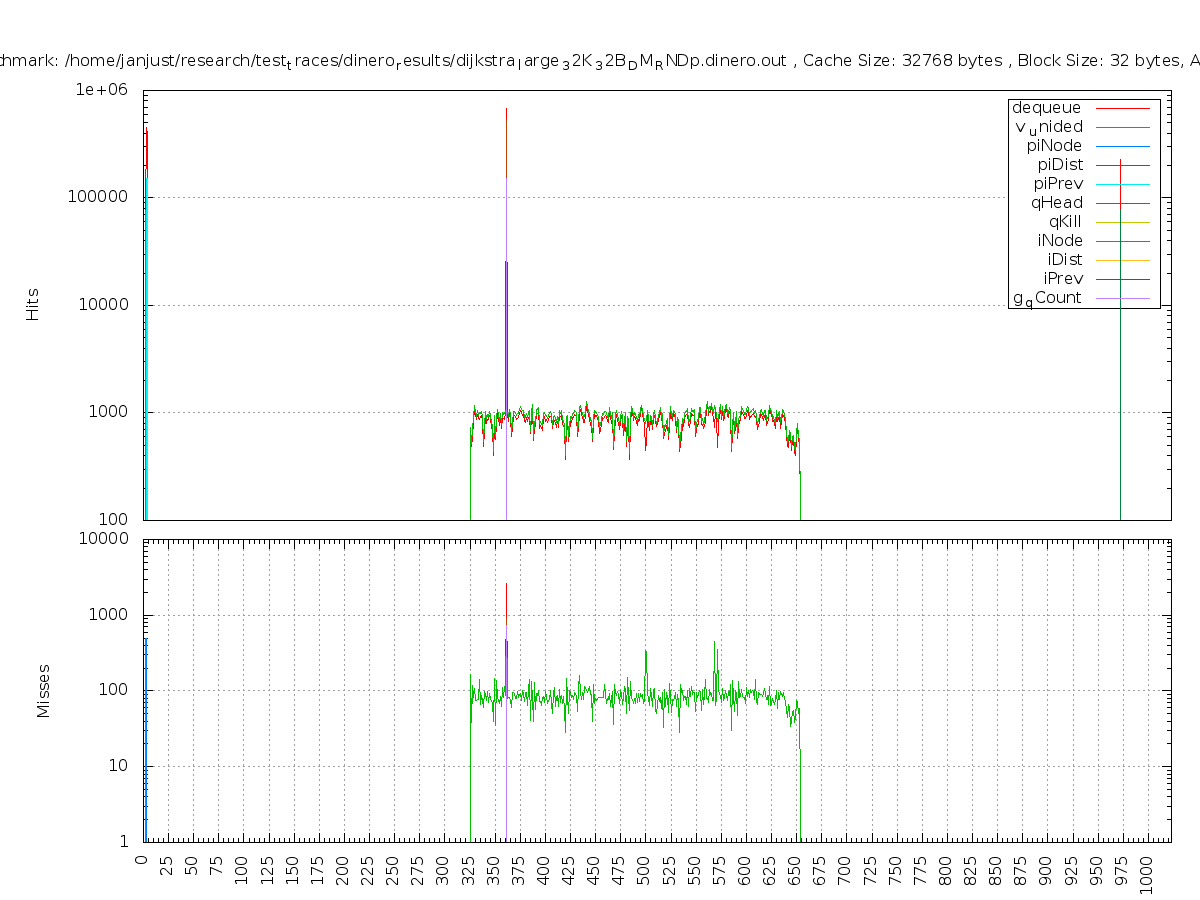
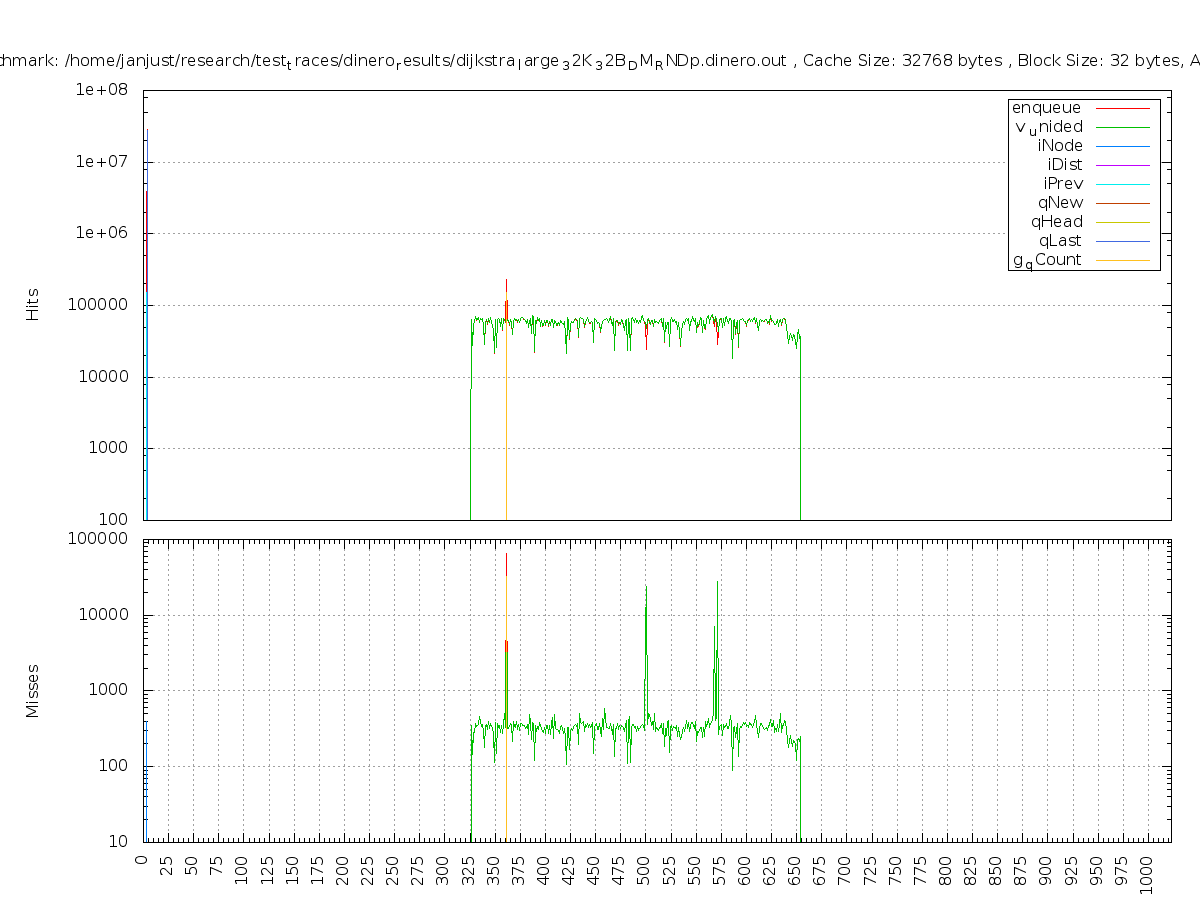
Currently we do not have a GUI to visualize the access statistics; however, we use a perl script to convert dinero output into a GNUplot script. Final result is a graphical representation of total cache behavior per each function (see below).
Running the script is straight forward. You may notice that only a subset of variables is plotted, you can change that by adjusting the $no_variables variable in the script.
$perl gen_gp_script_w_names.pl <path_to_dinero_trace_file> <function_to_trace>
The following figures depict the cache behavior for a variety of functions from themibench benchmark suite. The y-axis represents the number of hits and misses on a particular cache line (x-axis). It becomes obvious that certain cache lines remain highly underutilized.